Contact analysis: number of contacts within a cutoff
We calculate the number of salt bridges in an enzyme as it transitions from a closed to an open conformation.
Last executed: Feb 06, 2020 with MDAnalysis 0.20.2-dev0
Last updated: January 2020
Minimum version of MDAnalysis: 0.17.0
Packages required:
Optional packages for visualisation:
[1]:
import MDAnalysis as mda
from MDAnalysis.tests.datafiles import PSF, DCD
from MDAnalysis.analysis import contacts

import numpy as np
import pandas as pd
import matplotlib.pyplot as plt
%matplotlib inline
Loading files
The test files we will be working with here feature adenylate kinase (AdK), a phosophotransferase enzyme. ([BDPW09]) The trajectory DCD samples a transition from a closed to an open conformation.
[2]:
u = mda.Universe(PSF, DCD)
Defining the groups for contact analysis
We define salt bridges as contacts between NH/NZ in ARG/LYS and OE*/OD* in ASP/GLU. You may not want to use this definition for real work.
[3]:
sel_basic = "(resname ARG LYS) and (name NH* NZ)"
sel_acidic = "(resname ASP GLU) and (name OE* OD*)"
acidic = u.select_atoms(sel_acidic)
basic = u.select_atoms(sel_basic)
Calculating number of contacts within a cutoff
Below, we define a function that calculates the number of contacts between group_a and group_b within the radius cutoff, for each frame in a trajectory.
[4]:
def contacts_within_cutoff(u, group_a, group_b, radius=4.5):
    timeseries = []
    for ts in u.trajectory:
        # calculate distances between group_a and group_b
        dist = contacts.distance_array(group_a.positions, group_b.positions)
        # determine which distances <= radius
        n_contacts = contacts.contact_matrix(dist, radius).sum()
        timeseries.append([ts.frame, n_contacts])
    return np.array(timeseries)
The results are returned as a numpy array. The first column is the frame, and the second is the number of contacts present in that frame.
[5]:
ca = contacts_within_cutoff(u, acidic, basic, radius=4.5)
ca.shape
[5]:
(98, 2)
[6]:
ca_df = pd.DataFrame(ca, columns=['Frame',
                                  '# Contacts'])
ca_df.head()
[6]:
| Frame | # Contacts | |
|---|---|---|
| 0 | 0 | 69 |
| 1 | 1 | 73 |
| 2 | 2 | 77 |
| 3 | 3 | 77 |
| 4 | 4 | 85 |
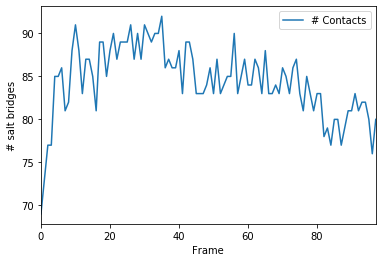
Plotting
[7]:
ca_df.plot(x='Frame')
plt.ylabel('# salt bridges')
[7]:
Text(0, 0.5, '# salt bridges')
References
[1] Oliver Beckstein, Elizabeth J. Denning, Juan R. Perilla, and Thomas B. Woolf. Zipping and Unzipping of Adenylate Kinase: Atomistic Insights into the Ensemble of Open↔Closed Transitions. Journal of Molecular Biology, 394(1):160–176, November 2009. 00107. URL: https://linkinghub.elsevier.com/retrieve/pii/S0022283609011164, doi:10.1016/j.jmb.2009.09.009.
[2] Richard J. Gowers, Max Linke, Jonathan Barnoud, Tyler J. E. Reddy, Manuel N. Melo, Sean L. Seyler, Jan Domański, David L. Dotson, Sébastien Buchoux, Ian M. Kenney, and Oliver Beckstein. MDAnalysis: A Python Package for the Rapid Analysis of Molecular Dynamics Simulations. Proceedings of the 15th Python in Science Conference, pages 98–105, 2016. 00152. URL: https://conference.scipy.org/proceedings/scipy2016/oliver_beckstein.html, doi:10.25080/Majora-629e541a-00e.
[3] Naveen Michaud-Agrawal, Elizabeth J. Denning, Thomas B. Woolf, and Oliver Beckstein. MDAnalysis: A toolkit for the analysis of molecular dynamics simulations. Journal of Computational Chemistry, 32(10):2319–2327, July 2011. 00778. URL: http://doi.wiley.com/10.1002/jcc.21787, doi:10.1002/jcc.21787.